Contents
A Cautious Outlook on Wall Street’s Bullish Run
Since the beginning of 2023, Wall Street has experienced a remarkable bullish surge. The Dow Jones Industrial Average, the S&P 500, and the Nasdaq Composite have soared to impressive heights, delivering returns of 26%, 47%, and 68% respectively, with each hitting multiple all-time highs. However, there are underlying factors suggesting that the foundations of this rally may be less stable than they appear.

While no indicator can predict short-term stock market movements with complete certainty, a few metrics have historically shown strong correlations with significant market shifts. Currently, three of these indicators are signaling potential downturns.
1. Historical Overvaluation of Stocks
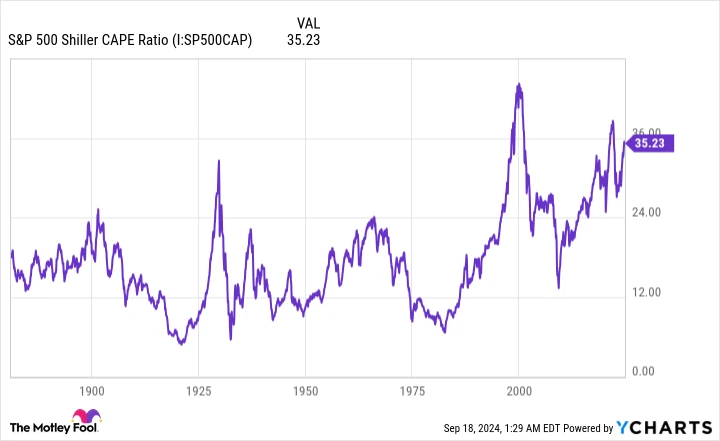
The S&P 500’s Shiller price-to-earnings (P/E) ratio, also known as the cyclically adjusted price-to-earnings (CAPE) ratio, provides insight into stock valuations. Unlike the traditional P/E ratio, which can be skewed by short-term economic shocks, the Shiller P/E ratio averages inflation-adjusted earnings over the past decade, offering a more reliable valuation measure.

As of September 17, the Shiller P/E ratio for the S&P 500 stood at nearly 36.3, significantly above its historical average of 17.16. Historically, when the Shiller P/E has exceeded 30 during bull markets, the S&P 500 has subsequently experienced losses of at least 20%. Although this metric is not a timing tool, extended high valuations have consistently preceded market corrections.
2. Yield-Curve Inversion and Economic Implications
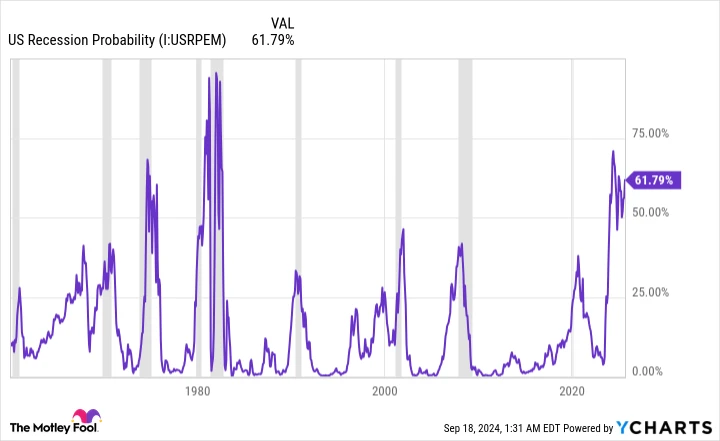
The Federal Reserve Bank of New York’s recession probability indicator, renowned for its accuracy over the past 58 years, currently forecasts a 61.79% chance of a U.S. recession by August 2025. This tool analyzes the yield spread between the 10-year Treasury bond and the three-month Treasury bill to predict economic downturns.

Typically, longer-term bonds offer higher yields than short-term bills, but when the yield curve inverts, shorter-term securities yield more, indicating investor uncertainty. Although not all yield-curve inversions lead to recessions, every recession since World War II has been preceded by one. While stock markets don’t always mirror economic conditions, recessions often depress corporate earnings, leading to market downturns.
3. Unprecedented Shift in U.S. M2 Money Supply
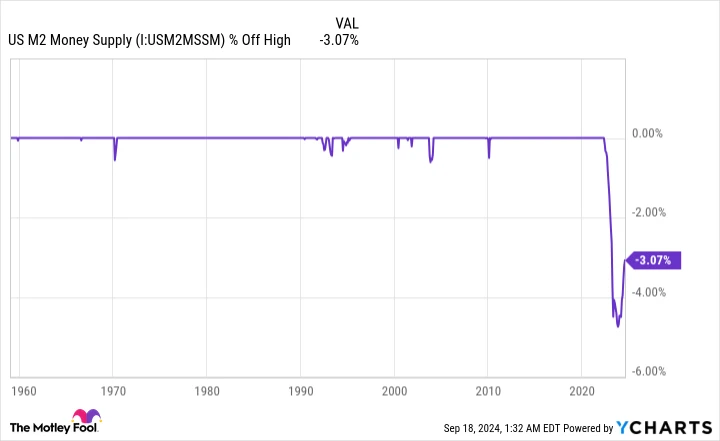
The U.S. M2 money supply, which includes cash, checking deposits, savings accounts, and certain certificates of deposit, has recently deviated from its long-term growth trend. After peaking in April 2022, the M2 money supply declined by 4.74% by October 2023, marking the first significant reduction since the Great Depression.

Historically, such declines in M2 have correlated with economic depressions and high unemployment. Although M2 has started to rise again year-over-year, it remains 3.07% below its peak, potentially limiting consumer spending and increasing recession risks.
The Undeniable Power of Time
While historical data and metrics provide valuable insights, they are not infallible predictors of short-term market behavior. Despite concerns about current valuations, time remains the most reliable factor in economic and market cycles. Recessions, though inevitable, are typically brief, with nine out of twelve U.S. recessions since World War II lasting less than a year.
On the other hand, periods of economic growth often extend over several years, with some lasting over a decade. This pattern is mirrored in stock market cycles, where bull markets generally outlast bear markets.
In June 2023, Bespoke Investment Group highlighted the longevity of bull markets compared to bear markets in the S&P 500 since the Great Depression. The typical bear market lasts around 286 days, while bull markets average 1,011 days, with nearly half enduring longer than the longest bear market.
Additionally, a Crestmont Research study on rolling 20-year total returns of the S&P 500 since 1900 found that every 20-year period yielded positive returns, reinforcing the long-term benefits of investing.
Strategic Investment Opportunities
While it’s prudent to prepare for potential market downturns, it’s essential not to overlook the benefits of time as an ally. The Motley Fool Stock Advisor service has consistently outperformed the S&P 500 since 2002, identifying opportunities to double down on stocks with substantial returns.
For example, investing $1,000 in Netflix in 2004, Nvidia in 2009, or Apple in 2008 when the service recommended doubling down would have resulted in significant returns.
Opportunities continue to arise. To explore current “Double Down” stock recommendations, consider the potential for future gains.
*Stock Advisor returns as of 09/23/2024


