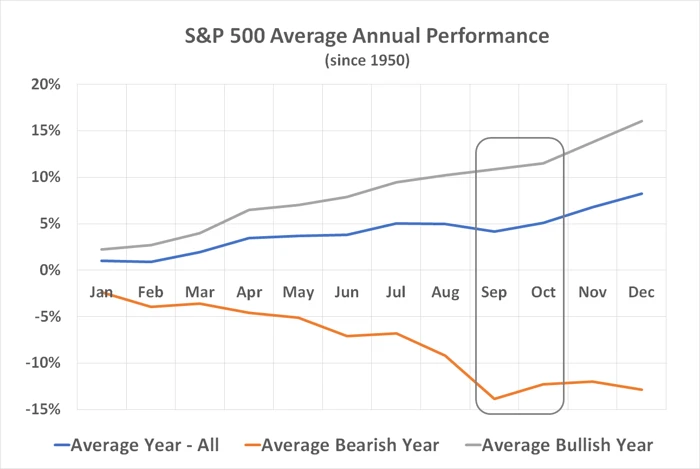
With the market experiencing a notable decline since the end of August, investors are understandably anxious about September potentially living up to its historically bearish reputation. Among the three months where the S&P 500 typically loses ground, September stands out with an average loss of nearly 0.9%, making it the harshest of the trio. In certain years, the losses have been even more severe, which is why the early market weakness this September is particularly troubling; it could signal further downturns ahead.
Before hastily selling off your stocks in a panic, however, it’s crucial to consider all relevant information about this trend. In fact, the wisest strategy might be to remain calm and disregard what appears to be the onset of a predictable September market dip.
Contents
September’s Market Statistics
To clarify, the belief that September is a tough month for stocks does have some basis. Since 1950, the S&P 500 has declined in 42 of the past 74 Septembers, while posting gains in just 32 of them. In years when the market falls, the average loss of 3.75% surpasses the average gain of 3.25% in positive years. Over the past century, this ill-fated month has more often seen declines than rises.
Some of this pattern and its significant average losses can be attributed to unfortunately timed events. For instance, the Septembers that followed the dot-com crash in 2000 were harsh, though not due to the collapse of numerous young internet companies coinciding with autumn. Similarly, the brunt of the 2008 subprime mortgage crisis was felt in September, but it could just as easily have occurred in another month.
Nevertheless, the calendar itself can play a part in September’s market issues. Historically, when agriculture was a major U.S. industry, this was the time when harvest yields became evident, potentially straining banks involved in farming. It has also been suggested that as summer vacations end, investors begin scrutinizing their portfolios more closely, accounting for any negative news previously overlooked. Additionally, while the U.S. government’s fiscal year starts in October, budget planning often begins in the preceding weeks.
Whether these factors still apply or not, to any extent they once did, they have arguably become part of a self-fulfilling prophecy, typically turning September into a losing month. However, it’s important not to let this influence short-term decisions about long-term investments.
The Rest of the Story
Though September is more often down than up, the data reveals an interesting detail: many September downturns have been followed by substantial October recoveries.
The statistics show that in 28 of the 42 September declines since 1950, the S&P 500 posted gains in the subsequent month. Over this 74-year period, the average performance from September’s start to the end of October is a modest gain of 0.14%. Only 29 times since 1950 has the September-October period resulted in a lower S&P 500. In some of its worst years, the index has rebounded from a dismal September with a strong October.

In simpler terms, the losses typically encountered in September are often reversed in October (and vice versa, incidentally).
The outlook becomes even more optimistic when extending the timeframe. From June’s start to November’s end, the S&P 500 has lost ground only 26 times since 1950, while increasing in 48 of those years, averaging a gain of 1.76% despite occasional sell-offs.
Admittedly, some of these instances were still quite challenging. However, they usually arose from extraordinary circumstances not tied to the time of year, such as during a bear market. These notably tough years include the 2008 subprime mortgage crisis and the aftermath of 1987’s “Black Monday.” Before that, the last time autumn was particularly brutal for the market was in 1973, during a recession-driven, inflation-riddled bear market.
Such downturns, while unpredictable, are rare. Attempting to predict them often causes more harm than benefit, pushing you out of the stock market when you should remain invested.
Remember: It’s About the Bigger Picture and Long-Term Outlook
This year might be one of the rare exceptions, where both September and October prove to be difficult months for the broader market. However, from a statistical standpoint, this is unlikely. Usually, any weakness in September is a temporary setback, giving way to the typical year-end bullish trend that begins in late October. The primary causes of disastrous Septembers are not currently looming, and the key contrarian bullish signal is that some economists are acknowledging the risk. In reality, most bear markets and recessions arise when least expected.
Our List of Winning Stock Picks is Set to Grow
In 1997, a little-known bookseller named Amazon entered the stock market. Since then, it has delivered an astounding 150,000%* return for investors, transforming an initial $1,000 investment into a nest egg exceeding $1 million*.
The Motley Fool’s Stock Advisor service identified this winner early for its members, initially in 2002 and subsequently ten more times. This is just one of the wealth-building stocks The Motley Fool has spotlighted with its ‘All In’ buy signal, enabling members to secure gains.
Netflix has surged 24,292%, turning a $1,000 investment since The Motley Fool went “All In” in June 2007 into $243,917!*
Tesla has increased by 701%, turning a $1,000 investment since The Motley Fool went “All In” in October 2020 into $8,012!*
Discovering stocks with the potential for life-altering returns necessitates extensive research and diligence. The Motley Fool undertakes this groundwork for its members, so ignoring its latest “All-In” buy alert might not be wise.
View the “All-in” Stock
*Stock Advisor returns as of 09/14/2024


